Overview Of Wimlds Chapters
History
WiMLDS is the acronym for “Women in Machine Learning & Data Science”. It was founded in 2013, and the group hosts meetups. This is the founding order of the chapters:
- San Francisco Bay Area, CA, USA: Dec 2013
- New York City, NY, USA: Oct 2014
- Cary, North Carolina, USA: Feb 2016
- Chicago, Illinois, USA: Mar 2016
Five years after the founding of WiMLDS, there are 30+ chapters worldwide in more than a dozen countries and 6 continents. (Antarctica remains unrepresented.) Total membership is 18K+.
Mission
The mission of WiMLDS is to support and promote women and gender minorities who are practicing, studying or are interested in the fields of machine learning and data science.
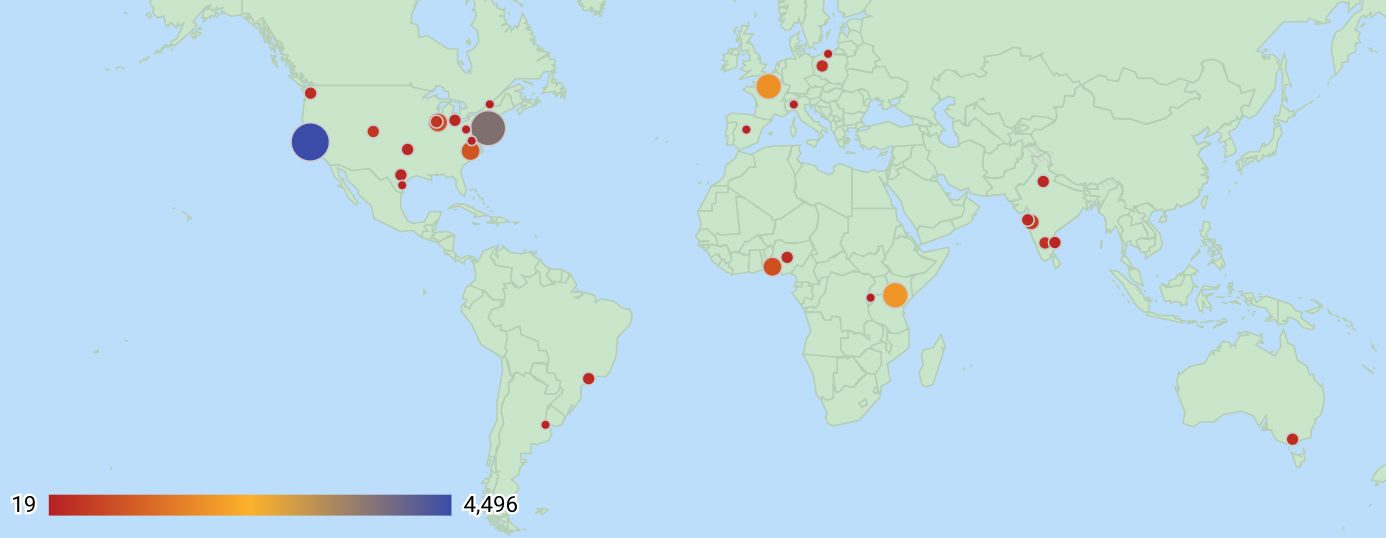
Map of WiMLDS Chapters
WiMLDS Chapters: USA & Canada
The 4 chapters in North America with the greatest membership are, unsurprisingly:
- San Francisco Bay Area, California (4.5K)
- New York, New York (3.7K)
- Cary, North Carolina (800+)
- Chicago, Illinois (750+)
WiMLDS Chapters: Outside of North America
The 5 chapters with the highest membership outside the USA are:
- Nairobi, Kenya
- Paris, France
- Lagos, Nigeria
- Pune, India
- Zurich, Switzerland
Note: France is where the Python library scikit-learn was developed.
India has 5 chapters:
- Pune
- Bengaluru
- Mumbai
- Delhi
- Chennai
Summary by Country
The 5 countries with the greatest membership are:
- USA
- Kenya
- France
- India
- Nigeria
Note: 4 of the top 5 are English-speaking countries.
Starting a New Chapter
Interested in starting a women's #DataScience or #MachineLearning meetup in your city? We'd love to help! Reach out at info@wimlds.org.
— Women+ in ML/DS (@wimlds) November 19, 2015
Connecting with WiMLDS
Follow us on Twitter at @wimlds. There is also a Twitter list of chapters.
Slack
We have a global Slack team for female and gender minority members of WiMLDS. To join, send an email request to slack@wimlds.org with a brief note.
Meetup Groups
A list of all chapters and their meetup group links can be found on our website.
Data & Tools
Data
- The statistics represented were updated October 2018.
Tools
- Google spreadsheets were utilized to store the data.
- Visualizations were produced using Google Data Studio.
Leave a Comment